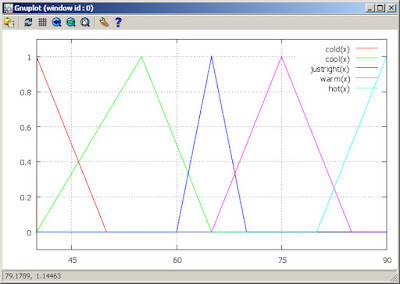
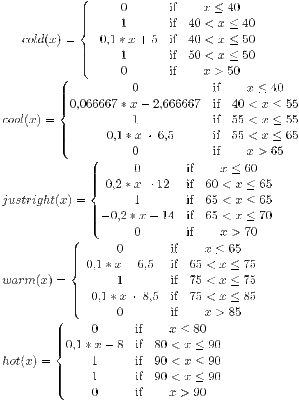
Piecewise function plotter
I've been working lately on a front-end application to draw and generate the piecewise-defined functions that are mainly used for the input fuzzy sets. This application is developed with Delphi and for generating the outputs it uses the GNUplot and the LateX equation editor. The application is called Thundax Piecewise v1.1 and you can download it from here. This win32 installation package contains the required files to work with the GNUplot. This software is for academical purposes and with it you can define the piecewise-defined functions without wasting your time trying to draw the graphs and the equations.
Using the application:
If you want to get the equations from the previous image, you only need to add the points (x,y) (defined as 4 points per graph), add the equation description, the range and the number of samples:
The description of the parameters:
Once everything is done, you just need to let the application generate the graph output automatically using GNUPlot (If the function is not plotted, check the script and execute it into the GNUplot command prompt):
- Points per graph: default value = 4. Number of points that are used to define the function:
- Range-x: Default value [0:30]. Range to be displayed at x-axis.
- Range-y: Default value [-0.1:1.1]. Range to be displayed at y-axis.
- Samples: default value = 1. Number of samples for the x-axis. In a range from 1 to 10 with a sample of 1 it will show all the numbers.
Once everything is done, you just need to let the application generate the graph output automatically using GNUPlot (If the function is not plotted, check the script and execute it into the GNUplot command prompt):
And then copy-and paste the output script to Latex editor and get the piecewise function for each one:
The only thing the applications does, is to parse the input data and transform it as scripts for the GNUplot and Latex. The conversion is pretty simple and the scripts examples are like these:
GNUPlot Script example:
cold(x)=(x<=40? 0: cold2(x))
cold2(x)=(x<=40 & x > 40? 1: cold3(x))
cold3(x)=(x<=50 & x > 40? -0.1*x + 5: cold4(x))
cold4(x)=(x<=50 & x > 50? 1: cold5(x))
cold5(x)=(x>50? 0:0)
cool(x)=(x<=40? 0: cool2(x))
cool2(x)=(x<=55 & x > 40? 0.066667*x  -2.666667: cool3(x))
cool3(x)=(x<=55 & x > 55? 1: cool4(x))
cool4(x)=(x<=65 & x > 55? -0.1*x + 6.5: cool5(x))
cool5(x)=(x>65? 0:0)
justright(x)=(x<=60? 0: justright2(x))
justright2(x)=(x<=65 & x > 60? 0.2*x  -12: justright3(x))
justright3(x)=(x<=65 & x > 65? 1: justright4(x))
justright4(x)=(x<=70 & x > 65? -0.2*x + 14: justright5(x))
justright5(x)=(x>70? 0:0)
warm(x)=(x<=65? 0: warm2(x))
warm2(x)=(x<=75 & x > 65? 0.1*x  -6.5: warm3(x))
warm3(x)=(x<=75 & x > 75? 1: warm4(x))
warm4(x)=(x<=85 & x > 75? -0.1*x + 8.5: warm5(x))
warm5(x)=(x>85? 0:0)
hot(x)=(x<=80? 0: hot2(x))
hot2(x)=(x<=90 & x > 80? 0.1*x  -8: hot3(x))
hot3(x)=(x<=90 & x > 90? 1: hot4(x))
hot4(x)=(x<=90 & x > 90? 1: hot5(x))
hot5(x)=(x>90? 0:0)
set yrange[-0.1:1.1]
set xtics 0, 15
set grid
set samples 1001
bind Close "exit gnuplot"
plot [40:90] cold(x) ,cool(x) ,justright(x) ,warm(x) ,hot(x)
Notice that we use the function bind Close "exit gnuplot" to bind the exit of the application once the user has closed the plotted graph. (And I think this function is available since version 4.4).
Latex Script example:
cold(x)=\begin{Bmatrix}{0}&\mbox{if}& x\leq40\\{1}&\mbox{if}& 40< x \leq40\\{-0.1*x + 5}&\mbox{if}& 40< x \leq50\\{1}&\mbox{if}& 50< x \leq50\\{0}&\mbox{if}& x > 50\end{matrix}\\
cool(x)=\begin{Bmatrix}{0}&\mbox{if}& x\leq40\\{0.066667*x  -2.666667}&\mbox{if}& 40< x \leq55\\{1}&\mbox{if}& 55< x \leq55\\{-0.1*x + 6.5}&\mbox{if}& 55< x \leq65\\{0}&\mbox{if}& x > 65\end{matrix}\\
justright(x)=\begin{Bmatrix}{0}&\mbox{if}& x\leq60\\{0.2*x  -12}&\mbox{if}& 60< x \leq65\\{1}&\mbox{if}& 65< x \leq65\\{-0.2*x + 14}&\mbox{if}& 65< x \leq70\\{0}&\mbox{if}& x > 70\end{matrix}\\
warm(x)=\begin{Bmatrix}{0}&\mbox{if}& x\leq65\\{0.1*x  -6.5}&\mbox{if}& 65< x \leq75\\{1}&\mbox{if}& 75< x \leq75\\{-0.1*x + 8.5}&\mbox{if}& 75< x \leq85\\{0}&\mbox{if}& x > 85\end{matrix}\\
hot(x)=\begin{Bmatrix}{0}&\mbox{if}& x\leq80\\{0.1*x  -8}&\mbox{if}& 80< x \leq90\\{1}&\mbox{if}& 90< x \leq90\\{1}&\mbox{if}& 90< x \leq90\\{0}&\mbox{if}& x > 90\end{matrix}\\
I'm still working on this project and for the next milestone I'll try to add the Weighted average method to calc the area of the graph and the ability to save the data of the project.
- Piecewise.
- http://t16web.lanl.gov/Kawano/gnuplot/intro/basic-e.html
- http://t16web.lanl.gov/Kawano/gnuplot/intro/working-e.html
- http://gnuplot.sourceforge.net/demo/fillcrvs.html
- http://objectmix.com/graphics/140283-quiting-gnuplot-upon-closure-plotting-window.html
- http://gnuplot.sourceforge.net/demo/rainbow.html
- Example of a Mamdani/Larsen fuzzy controller
- Latex Render.


%20applied%20to%20Transformer%20models%20in%20machine%20learning.%20The%20image%20shows%20a%20neural%20networ.webp)

Comments
Post a Comment