Creando un histograma de colores de una Imagen
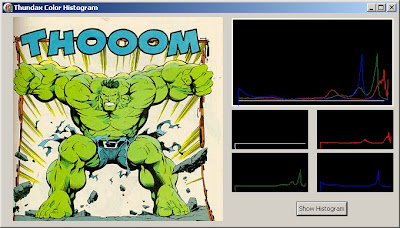
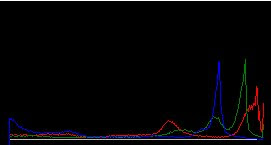
 Aquí os dejo una unit THistogram, que nos permite dibujar un histograma de colores de una Imagen y además permite disponer de cada componente por separado (RGB + Gray). El componente es muy sencillo, y simplemente lo que hago es un barrido de la imagen con ScanLine, y incrementar la localización de los diferentes pixels en una estructura RGBGray con los 4 componentes. De esta manera, podemos saber la cantidad de color que tenemos en una imagen y podemos ver en el histograma la forma que tiene la cantidad de color. El componente se puede mejorar muchísimo, y simplemente doy una idea de como continuar. Aquí os dejo un pantallazo del cálculo sobre una imagen. La creación de un histograma sobre una imagen se utiliza en visión por ordenador, y está bastante bien explicado por internet. En la wiki, también lo podemos encontrar.

Como podéis comprobar, las funciones del TCanvas son ilimitadas, y podemos hacer lo que queramos con este componente. Desde dibujar gráficos como crear diferentes formas y figuras. En muchos de mis artículos he demostrado diversas configuraciones con el TCanvas y las cosas que se pueden hacer.
Aquí os dejo el código fuente:
HistogramUnit:
//***************************************
// Thundax Software
//@Author : Jordi Coll
//***************************************

unit HistogramUnit;

interface

uses
    Windows, ExtCtrls;

type
    THistColour = (TRed, TGreen, TBlue, TGray);

    TColour = record
        Gray: integer;
        Red : integer;
        blue : integer;
        green : integer;
    end;

    THistogram = class(TObject)
    private
        MaxCount: Integer;
        Colour: array[0..255] of TColour;
        FLeftMargin: integer;
        FRightMargin: integer;
        FBottomMargin: integer;
        procedure SetLeftMargin(const Value: integer);
        procedure SetRightMargin(const Value: integer);
        procedure SetBottomMargin(const Value: integer);
        procedure DrawRectangle(image1: TImage; BackGroundColor, RectangleColor: integer);
        function GetColourValue(i: integer; index: integer): integer;
        function GetPlotColour(i: integer): integer;
    public
        property LeftMargin: integer read FLeftMargin write SetLeftMargin;
        property RightMargin: integer read FRightMargin write SetRightMargin;
        property BottomMargin: integer read FBottomMargin write SetBottomMargin;
        constructor Create();
        procedure CalcHistogram(Image: Timage);
        procedure DrawHistogram(Image: TImage);
        procedure DrawComponentHistogram(Image: TImage; Component: THistColour);
    end;

implementation

uses
    SysUtils, Graphics;

{ THistogram }

procedure THistogram.CalcHistogram(Image: Timage);
var
    i, j: integer;
    pixelImg: PByteArray;
begin
    if Image.Picture.Bitmap.PixelFormat = pf8bit then
    begin
        for i := 0 to Image.Height - 1 do
        begin
            pixelImg := Image.Picture.Bitmap.ScanLine[i];
            for j := 0 to Image.Width - 1 do
                Inc(Colour[pixelImg[j]].Gray);
        end;
        MaxCount := 0;
        for i := 0 to 255 do
            if Colour[i].Gray > MaxCount then
                MaxCount := Colour[i].Gray;
    end;
    if Image.Picture.Bitmap.PixelFormat = pf24bit then
    begin
        for i := 0 to Image.Height - 1 do
        begin
            pixelImg := Image.Picture.Bitmap.ScanLine[i];
            for j := 0 to Image.Width - 1 do
            begin
                Inc(Colour[pixelImg[3 * j]].Blue);
                Inc(Colour[pixelImg[3 * j + 1]].Green);
                Inc(Colour[pixelImg[3 * j + 2]].Red);
            end;
        end;
        for i := 0 to 255 do
        begin
            if Colour[i].Red > MaxCount then
                MaxCount := Colour[i].Red;
            if Colour[i].Green > MaxCount then
                MaxCount := Colour[i].Green;
            if Colour[i].Blue > MaxCount then
                MaxCount := Colour[i].Blue;
        end;
    end;
end;

constructor THistogram.Create;
var
    i: integer;
begin
    MaxCount := 0;
    FLeftMargin := 10;
    FRightMargin := 10;
    FBottomMargin := 10;
    for i := 0 to 255 do
    begin
        Colour[i].gray := 0;
        Colour[i].Blue := 0;
        Colour[i].Green := 0;
        Colour[i].Red := 0;
    end;
end;

procedure THistogram.DrawRectangle(image1: TImage; BackGroundColor: Integer; RectangleColor: integer);
begin
    image1.Canvas.Brush.Style := bsSolid;
    image1.Canvas.Brush.Color := BackGroundColor;
    image1.Canvas.Pen.Width := 3;
    image1.Canvas.Pen.Color := RectangleColor;
    image1.Canvas.Rectangle(0, 0, image1.Width, image1.Height);
end;

procedure THistogram.DrawComponentHistogram(Image: TImage; Component: THistColour);
var
    i: integer;
    value, col, CalcTemp: integer;
begin
    value := 0;
    col := 0;
    case Component of
        TRed: col := clRed;
        TGreen: col := clGreen;
        TBlue: col := clBlue;
        TGray: col := clsilver;
    end;
    DrawRectangle(Image, clBlack, clBlack);
    with Image do
    begin
        Canvas.Pen.Width := 1;
        Canvas.MoveTo(FLeftMargin, Width - FBottomMargin);
        Canvas.Pen.Color := col;
        for i := 1 to 255 do
        begin
            case Component of
                TRed: value := Colour[i].Red;
                TGreen: value := Colour[i].Green;
                TBlue: value := Colour[i].Blue;
                TGray: value := Colour[i].Gray;
            end;
            CalcTemp := round((Height - (2 * FRightMargin)) * value / MaxCount);
            Canvas.LineTo(Round((FLeftMargin + i) * ((Width - FRightMargin) / 255)), (Height - FRightMargin) - CalcTemp);
        end;
    end;
end;

procedure THistogram.DrawHistogram(Image: TImage);
var
    i, j, CalcTemp: integer;
begin
    DrawRectangle(Image, clBlack, clBlack);
    with Image do
    begin
        Canvas.Pen.Color := clwhite;
        Canvas.Rectangle(0, 0, Width, Height);
        Canvas.Pen.Width := 1;
        for j := 0 to 3 do
        begin
            Canvas.MoveTo(FLeftMargin, Width - FBottomMargin);
            Canvas.Pen.Color := GetPlotColour(j);
            for i := 1 to 255 do
            begin
                CalcTemp := round((Height - (2 * FRightMargin)) * GetColourValue(i, j) / MaxCount);
                Canvas.LineTo(FLeftMargin + i, (Height - FRightMargin) - CalcTemp);
            end;
        end;
    end;
end;

function THistogram.GetColourValue(i: integer; index: integer): integer;
var
    value: integer;
begin
    value := 0;
    case index of
        0: value := Colour[i].gray;
        1: value := Colour[i].Red;
        2: value := Colour[i].Green;
        3: value := Colour[i].Blue;
    end;
    result := value;
end;

function THistogram.GetPlotColour(i: integer): integer;
var
    value: integer;
begin
    value := 0;
    case i of
        0: value := clSilver;
        1: value := clRed;
        2: value := clGreen;
        3: value := clBlue;
    end;
    result := value;
end;

procedure THistogram.SetBottomMargin(const Value: integer);
begin
    FBottomMargin := Value;
end;

procedure THistogram.SetLeftMargin(const Value: integer);
begin
    FLeftMargin := Value;
end;

procedure THistogram.SetRightMargin(const Value: integer);
begin
    FRightMargin := Value;
end;

end.
Aquí la manera de implementarlo sería:
procedure TForm3.Button1Click(Sender: TObject);
var
    hist: THistogram;
begin
    hist := THistogram.create();
    hist.CalcHistogram(Image1); //Imagen a escanear
    hist.DrawHistogram(Image3); //Imagen donde mostrarlo
    hist.DrawComponentHistogram(Col1, TGray); //Imagen componentes
    hist.DrawComponentHistogram(Col2, TRed);
    hist.DrawComponentHistogram(Col3, TGreen);
    hist.DrawComponentHistogram(Col4, TBlue);
    FreeAndNil(hist);
end;
Aquí os dejo la aplicación por si la queréis ver: ThundaxColourHistogram.
%20applied%20to%20Transformer%20models%20in%20machine%20learning.%20The%20image%20shows%20a%20neural%20networ.webp)

Comments
Post a Comment